Thursday, July 30, 2009

Out of EDZ FAZ TZA at 30% losses, Begin USD @ $27.46 with 3% Trailing Stop


IUC: Down 78K! + Q3 Earnings Conundrum


Link to Release


The highest insured unemployment rates in the week ending July 11 were in Puerto Rico (7.3 percent), Michigan (7.2), Oregon (6.7), Pennsylvania (6.4), Nevada (6.2), Wisconsin (6.1), Connecticut (5.6), New Jersey (5.6), Arkansas (5.5), California (5.5), North Carolina (5.5), and South Carolina (5.5).

The largest increases in initial claims for the week ending July 18 were in California (+4,290), Michigan (+3,654), Florida (+3,291), Connecticut (+749), and Indiana (+526),

while the largest decreases were in New York (-22,052), Wisconsin (-6,791), Missouri (-6,529), Pennsylvania (-6,420), and Ohio (-5,062).

Wednesday, July 29, 2009

RESTOCKING : Key Word for Q3

JUL Fed Beige Book Release

Q3 EPS Theory


5mo Chart
Note the bounces off of the 10EMA MAR through JUN.

JUN DGO: New Orders up $12B MAY to JUN!

Link to PDF

New Orders

[Seasonally adjusted] New orders for manufactured durable goods in June decreased $4.1 billion or 2.5 percent to $158.6 billion, the U.S. Census Bureau announced today. This decrease followed two consecutive monthly increases including a 1.3 percent May increase. Excluding transportation, new orders increased 1.1 percent. Excluding defense, new orders decreased 0.7 percent.

Shipments

[Seasonally adjusted] Shipments of manufactured durable goods in June, down eleven consecutive months, decreased $0.3 billion or 0.2 percent to $168.3 billion. This was the longest streak of consecutive monthly decreases since the series was first published on a NAICS basis in 1992 and followed a 2.6 percent May decrease.

Unfilled Orders

Unfilled orders for manufactured durable goods in June, down nine consecutive months, decreased $6.6 billion or 0.9 percent to $740.1 billion. This followed a 0.3 percent May decrease.

Inventories

Inventories of manufactured durable goods in June, down six consecutive months, decreased $3.0 billion or 0.9 percent to $318.8 billion. This followed a 1.1 percent May decrease.

Capital Goods Industries

Nondefense

Nondefense new orders for capital goods in June decreased $1.8 billion or 3.4 percent to $51.3 billion.

Defense

Defense new orders for capital goods in June decreased $3.4 billion or 28.3 percent to $8.6 billion.

Monday, July 27, 2009

Patience

As I listen to that putz Denis Kneel gloat over calling the recession over a month ago with today's issuance of (insignificant) New Home Sales I can't help but reflect upon a prior post about such things.

Revenues to Employment Ratio


Throughout earnings season everyone's all of a sudden flippin' out over top line (revenues) vs payroll cuts, thus margin. Funny how over the last three months no one said "Boo" about such, but now are.

So lettuce check out the ratio between the two largest measures of both: Retail Sales & Employment.

The number everyone's clucking about these days is UNemployment, which is silly in regards to earnings.
Stocks rise & fall based upon expected earnings, of which employment is a factor, not the number of people whom are not working.

Employed people cost money/earnings.
Unemployed people cost earnings nothing.
Obviously increasing unemployment may drag on revenues, but as long as revenues & employment move in tandem so will earnings.
Revenues can drop, but if employment drops with it earnings remain stable.
Should revenues increase on flat employment earnings will increase, and that is the foundation & hope of the current stupid run.

I wanna see if by following the monthly Revenues to Employment ratio if we can get a feel for how Q3 EPS will turn out.
Fluctuations in the $USD will affect revenues.

Saturday, July 25, 2009

Q3, Retail Sales & this Current Big, Stupid Run


Just in case I haven't made it clear: I hate adjusted numbers.

They are bullsh!t.

Corporations don't report revenues in seasonally adjusted numbers, so I fail to understand the benefit of headlining econ fundies in seasonally adjusted numbers.

This current run is just plain stupid.
Why is the market on a run with mass job cuts continuing and unemployment being widely & overtly touted as continuing to worsen from 9.5% to 10% (which means it will probably get worse than that)?

Corporations are as lean as they are likely to get from both an employment & inventory vantage point.
Productivity/revenue per employee is as high as it is likely to get.
If the stimulus spending out-paces housing induced credit loss spending then any additional revenue that comes corporate ways will add to the top line while expenses/labor remain level will show up as additional earnings.

Viewed in that light, the run is justifiable.

Thursday, July 23, 2009

Q3 EPS', $USD & $WTIC


Initial Unemployment Claims : Down 90K to Spring/Summer Average

The highest insured unemployment rates in the week ending July 4 were in

Puerto Rico (6.9 percent),

Michigan (6.8),

Oregon (6.8),

Pennsylvania (6.4),

Nevada (6.2),

Wisconsin (6.1),

South Carolina (5.7),

New Jersey (5.6),

North Carolina (5.5), and

Connecticut (5.4).


The largest increases in initial claims for the week ending July 11 were in

New York (+12,504),

North Carolina (+10,382),

Florida (+10,043),

Missouri (+8,293), and

Tennessee (+6,943),


while the largest decreases were in

Michigan (-6,648),

Massachusetts (-2,910),

New Jersey (-2,888),

Indiana (-2,497), and

California (-1,755).


Thursday, July 16, 2009

... one week later... * * * EPS over rides fundies * * *

* * * EPS over rides fundies * * *

Econ events should have driven this week through the floor.


Yet...
We started the week with Meridith Whitney Day! (OMG.)
Followed by GS EPS (results which won't carry over to the rest of the financials).
Followed by INTC selling a bunch of stuff to China (they say they'll do it again in Q3).
And JPM has put out some decent numbers.

However, if you look at top line Revenues across many of the Q2 EPSs of companies you've actually heard of, you'll see many flat to dropping Q1 to Q2.

I hope some more of that govt. stimulus is coming.


* * * EPS over rides fundies * * *

Initial Unemployment Claims = UP! (Again!) 86,000 New Claims!


Link to Release


UNEMPLOYMENT INSURANCE WEEKLY CLAIMS REPORT

SEASONALLY ADJUSTED DATA

In the week ending July 11, the advance figure for seasonally adjusted initial claims was 522,000, a decrease of 47,000 from the previous week's revised figure of 569,000. The 4-week moving average was 584,500, a decrease of 22,500 from the previous week's revised average of 607,000.

The advance seasonally adjusted insured unemployment rate was 4.7 percent for the week ending July 4, a decrease of 0.5 percentage point from the prior week's revised rate of 5.2 percent.

The advance number for seasonally adjusted insured unemployment during the week ending July 4 was 6,273,000, a decrease of 642,000 from the preceding week's revised level of 6,915,000. The 4-week moving average was 6,666,750, a decrease of 110,250 from the preceding week's revised average of 6,777,000.

The fiscal year-to-date average for seasonally adjusted insured unemployment for all programs is 5.449 million.

UNADJUSTED DATA

The advance number of actual initial claims under state programs, unadjusted, totaled 667,534 in the week ending July 11, an increase of 86,389 from the previous week. There were 483,981 initial claims in the comparable week in 2008.

The advance unadjusted insured unemployment rate was 4.6 percent during the week ending July 4, an increase of 0.1 percentage point from the prior week. The advance unadjusted number for persons claiming UI benefits in state programs totaled 6,135,066, an increase of 63,714 from the preceding week. A year earlier, the rate was 2.3 percent and the volume was 3,118,724.


The largest increases in initial claims for the week ending July 4 were in
Michigan (+12,144),
New York (+8,913),
Wisconsin (+5,838),
Indiana (+5,430), and
Ohio (+4,240),

while the largest decreases were in
New Jersey (-5,030),
California (-4,293),
North Carolina (-3,983),
Kansas (-3,544), and
Oregon (-1,454).

Wednesday, July 15, 2009

INTC & Leveraged ETFs

JUN: iProd 95.4 + CapU 68.0

Release Schedule (available at 9:15 a.m.)


iProd down + CapU down!


This week has many fun & exciting econ releases, JUN Retail Sales being the biggest.

Despite PPI (flat), despite CPI (flat), despite EIA CO reserves (flat to increasing), despite housing starts & permits (OMG, they need to drop, but the market would see that as weakness) the second biggest econ event is JUN Industrial Production & Utilization.

I can't find non-Seasonally Adjusted numbers, so we'll just have to deal with what we have.

Given retail sales & consumer sentiment & inventory drops & no real good reason for everyone to order stuff I suspect production & utilization to both be down.

Prescient, eh?

Fly in the ointment: MAY DGO New Orders were up.
This may mean an increase in JUN iProd&CapU.

Tuesday, July 14, 2009

Q2 2009 EPS Releases of S&P Top 20


Link to Quarterly EPSs

Link to Currency Grief


Currently the links below are to press releases by the companies.
As 10-Qs are made available I'll update to those as they may contain additional information.

JUN 14
JNJ $1.18 actual - $1.11 estimated
INTC (Excluding EU fine) $0.18 actual - $0.08 estimated

JUN 16
IBM $2.32 a - $2.02 e
JPM $0.28 a - $0.30 e
GOOG $4.66 a - $4.50 e

JUN 17
GE $0.26 a - $0.24 e
BAC $0.33a - $0.12 e

JUN 21
AAPL $1.35 a - $1.15 e
KO $0.88 a - $0.89 e

JUN 22
WFC $0.57 a - $0.37 e
PEP $1.06 a - $0.99 e
PFE $0.34 a - $0.47 e

JUN 23
MSFT $0.34 a - $0.38 e
T $0.54 a - $0.53 e

JUN 30
XOM $0.84 a - $0.95 e

JUN 31
CVX $0.87 a - $1.06 e

AUG 5
PG $0.80 a - $0.79 e
CSCO $0.24 e

AUG 13
WMT $0.85 e

AUG 18
HPQ $0.88 e

JUN Retail Sales


Link to Site

JUN Advance PDF


ADVANCE MONTHLY SALES FOR RETAIL AND FOOD SERVICES
June 2009


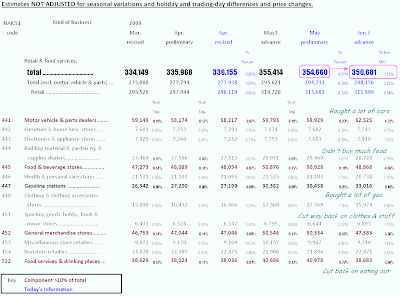
The U.S. Census Bureau announced today that advance estimates of U.S. retail and food services sales for June, adjusted for seasonal variation and holiday and trading-day differences, but not for price changes, were $342.1 billion, an increase of 0.6 percent (±0.5%) from the previous month, [LOL! The truth is otherwise, a 1.12% drop!], but 9.0 percent (±0.7%) below June 2008.

Total sales for the April through June 2009 period were down 9.6 percent (±0.5%) from the same period a year ago.
The April to May 2009 percent change was unrevised from 0.5 percent (±0.3%).

Retail trade sales were up 0.8 percent (±0.7%) from May 2009, but 10.0 percent (±0.7%) below last year.

Gasoline stations sales were down 31.6 percent (±1.5%) from June 2008 and motor vehicle and parts dealers sales were down 14.1 percent (±2.5%) from last year.

The advance estimates are based on a subsample of the Census Bureau’s full retail and food services sample. A stratified random sampling method is used to select approximately 5,000 retail and food services firms whose sales are then weighted and benchmarked to represent the complete universe of over three million retail and food services firms. Responding firms account for approximately 65% of the MARTS dollar volume estimate. For an explanation of the measures of sampling variability included in this report, please see the Reliability of Estimates section on the last page of this publication. Percent Change in Retail and Food Services Sales
(Estimates adjusted for seasonal variation and holiday and trading-day differences, but not for price changes)

The Advance Monthly Sales for Retail and Food Services for July is scheduled to be released August 13, 2009 at 8:30 a.m. EDT.

Sunday, July 12, 2009

Biggest 4 Week Losers: May be the Biggest Gainers at the Next Bottom


Link to first nine

Link to remainder

S&P Top 20 Component Q2 EPS Release Dates


JUN Retail Sales is the big scheduled econ event for the week, on the 14th.
Consensus is flat at 50-something.
I'm expecting something a wee south of that.

Just the same, all the hub-bub will be about earnings season, and I don't know if that will drown out Retail Sales or just reflect it.

Link to quarterly EPS recent past & current guesstimates.

Link to candle glance of JUL 13 to 17 group.

Link to candle glance of JUL 20 to 24 group.

Link to candle glance of JUL 27 through AUG group.

Friday, July 10, 2009

Strikes One, Two & Three... Leading to Strike Four?


THU's Same Store Sales (raw data not available) was generally poor.

Today's preliminary Michigan Consumer Sentiment was surprisingly poor.

It was not far off and fairly reflective of the JUN 30th also (surprisingly) poor JUN Consumer Confidence report.

0830 next TUE will be the week's biggest scheduled econ event: Retail Sales.

JUN Same Store Sales (in red) cover a large % of the Retail Sales total.
I think it fair to extrapolate diminishing data in SSS (maybe even sporting goods, as well) plus a known crack spread decline can't be good for Gasoline Stations (8-9% of total) and we can anticipate a poor non-adjusted JUL Retail Sales.
(The powers that be can divide the real numbers by whatever pie-in-the-sky <1.0)

Thursday, July 9, 2009

SPY at Short Term TA Bottom: Time to Look for Longs


Link to EDC & TNA chart

(FAZ is being a freak with their reverse split.)

OEF is next week, so its a wee close for JUL calls.

SPY AUG $90 calls


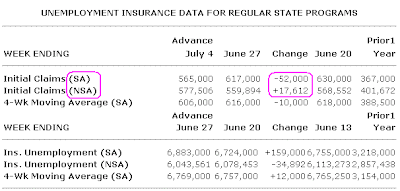
Initial Claims : Not Seaonally Adjusted = UP 17K, Seasonally Adjusted = DOWN 52K


Link to Current Data


LOL!

U.S. jobless claims drop steeply

Burried in the article:
>> The "seasonal factors" the department uses to adjust the data to provide a better sense of the underlying trend had expected a large increase in claims in the latest week. Actual claims in fact rose by a much smaller amount, which when seasonally adjusted, generated a large fall. <<


Wednesday, July 8, 2009

S&P 500 Top 20 by Weighting Q2 EPS Release Dates & Estimates

A: I tried to C&P this data as a table, but it didn't work.
I've an idea on a work-around, but don't have time at the moment.

B: It drives me nuts that we live in a culture where we read left to right, chart left to right, yet disseminate "current" then "from"

Ex: "The company's Q2 EPS was $1.25, up from $1.00 in Q1".

Ex: "The JUN data was 1.25, down from 1.50 in MAY."


Information should be presented as "Data moved from 1.50 in MAY down to 1.25 in JUN."

Many earnings data sets are presented with most recent on the left.
Then put Next Q estimates to the far right.
WTH?
I have to waste brain power converting left to right to mentally graph time progression.


I hate (stupid) people.


PS, with the invention of electric typewriters we could have ditched the deliberately inefficient QWERTY keyboard and gone to the much more efficient Dvorak system.


Coulda done it with computers.
Coulda done it with Blackberries.
Coulda done it with current text phones.
Soon as this stuff moved away from professional secretaries into the domain of retail consumers the conversion could have been made.


I hate (stupid) people.

Monday, July 6, 2009

JUN Non-Manufacturing ISM : 47.0

TA Babylon

As I read around the blogs & message boards it's clear that no one has a clue.

$USD: "a primary global reserve currency will likely remain intact for years to come."

Sunday, July 5, 2009