Friday, September 25, 2009
Throw Momma Under the Bus : Stocks to Short & Put
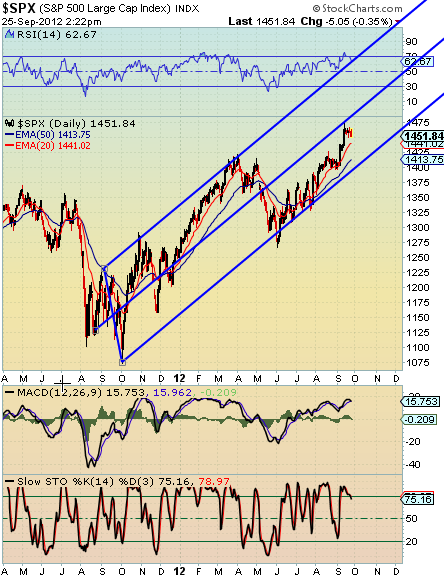
 Obviously, at the top of any SPX run to circa 1100 is when you'd wanna get on board with these.
Short Group Candle Glance
Put Group Candle Clance
Friday, September 18, 2009
Wednesday, September 16, 2009
Saturday, September 12, 2009
Friday, September 11, 2009
Looking for a Legit Breach

The bullish argument is getting increasingly difficult as conflicting data rolls in.
JUL Total Consumer Credit just came in at a $21.5B loss - while - JUL Retail Sales came in $4.5B higher.
JUL CapU & iProd fell off a cliff as actual employment rose by 229,000 jobs.
Gooooood Gravy!
Actual employment dropped from JUL to AUG by 981,000.
(NFP & unemployment are such magician misdirections from what's really happening).
Does actual employment lead CapU & iProd?
I dunno?
I'm also dying to see if AUG Retail Sales and Durable Goods Orders + Non-DGO also drop with employment or if they remain high simply adding to Q3 revenues & earnings.
However, for the very short term I see a what-have-you EWT pattern bull run to SPX >1100 (Note the AUG 4 date!) to complete wave 5 of C.
Then all hell can break loose.
I have a hard time with the perpetual "The markets gonna fall simply because it's up" argument.
Dumb reason or not, there's gotta be a reason, a catalyst, to kick this bull in the balls, and... it just hasn't gotten here, yet.
I'm just waiting.
Using these Treasury auction bid-to-cover ratios as financial sonar "pings" to see how much money is out there on the sidelines + the unspent stimulus money I can conjure a truly ice cold, bear nightmare: What if what we all think is going to be EWT ABC5 of 2 @ SPX circa 1100 is actually... only A of 2!
Thursday, September 10, 2009
Wednesday, September 9, 2009
Tuesday, September 8, 2009
Monday, September 7, 2009
Sunday, September 6, 2009
Saturday, September 5, 2009
AUG Retail Sales & DGO Targets/Adjusted Targets : RS $348,983/$339,146 , DGO-S $173,692/$184,692
A Q3 monthly ratio above these equals greater EPSs than Q2
Q2 RS/Employee = 2.47
Q2 DGO-S/Employee = 1.24
Total Employment x Q2 RS/E = RS Target
JUL : 141,055 x 2.47 = $348,406 Target - $355,243 delivered = -$6,837 adjustment to AUG target
AUG : 140,074 x 2.47 = $348,983 Target + (-$6837) adjustment = $339,146 adjusted target
Total Employment x Q2 DGO-S/E = DGO-S Target
JUL : 141,055 x 1.24 = $174,908 Target - $163,971 delivered = $10,937 adjustment to AUG target
AUG : 140,074 x 2.47 = $173,692 Target + $10,937 adjustment = $184,692 adjusted target
Friday, September 4, 2009
Thursday, September 3, 2009
Tuesday, September 1, 2009
JUL ISM Looking Very Nice: From JUL 48.9 to AUG 52.9, New Orders from JUL 55.3 to AUG 64.9

Investors were expecting the improvement, and many may have decided to take some money out of the market, playing it safe ahead of the government's August employment report, which comes out Friday.
"The market's priced all of this in, and a lot more, quite frankly, I can't imagine a piece of fundamental information that could meaningfully impact this market upward or downward," said Jeff Buetow, managing partner at Innealta Portfolio Advisors.
Subscribe to:
Posts (Atom)


