Tuesday, June 30, 2009
Wednesday It's All About the JUN ISM at 10am : MAY 42.8, JUN consensus 44.0
Link to MAY chart
Link to News Release page
Link MAY ISM report
What we're really looking for is New Orders.
Note that any PMI number below 50 is still a decrease in manufacturing activity.
44 would be a slower loss than 42.8, but that's still the same as... NFP dropping by only 300k jobs rather than the previous 400k jobs.
We'd still be losing jobs! Thus the unemployment continues to increase.
Likewise, ISM at 44 is still a contraction (or loss) in manufacturing economic activity.
Be mindful of a surprise "less than consensus" number like we saw with the consensus miss on JUN Consumer Confidence.
Consider it a down day on a miss because right on it's heels will be a likely poor NFP + unemployment number THU.
The only thing that can confuse the trading day would be a "less bad"/positive (immaterial) ADP report and a negative ISM.
If both positive then it should be a great day.
Still, be wary of THU's NFP.
10:30am update:
Headline number at 44.8 is "less bad"/favorable (although still clearly not good at all).
However, future orders are down from MAY 51.1 to JUN 49.2.
Does not bode well for JUL's headline.
Econ Events Into AUG + Prediction
As we saw from today's surprise drop JUN Consumer Confidence conensus & my own estimates can certainly be wrong.
I cannot emphasize enough how much my own bias & estimates rely on the seasonal up-swell of Existing Home sales into summer that will drop off into fall & over winter.
A lot of hopium is being placed on increasing home sales & price stabilization as a market bottom rather than my PoV that it is simply an ongoing disaster mitigation event.
Summer draws down = home sales draw down
Home sales draw down + increasing unemployment = more home inventory
More home inventory = drop in prices
Drop in prices = decreased homeowner equity/net worth
Decreased homeowner equity/net worth + increasing unemployment = decreased consumer spending
Decreased consumer spending = smaller EPSs
Smaller EPSs + same PE ratios = dropping market
If both EPSs + shrinking PE ratios = rapidly decaying market as money flows out of equities & commodities and into $USD & treasuries.
The good news is that gas prices should also drop!
"Yes", deflation concerns will be back on the table.
What I don't know is how government spending/overt jobs bills will counter any drop in consumer spending.
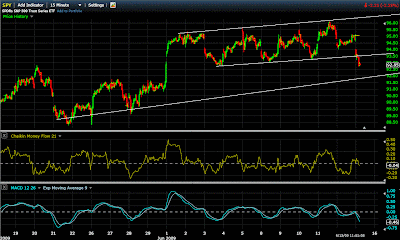
SPY Chart of the Week!
Both today & tomorrow we have some positive econ news on deck, so we're looking at some more justifiable gains.
However, THU's NFP is guesstimated to be a first monthly increase in losses in a while so that could be a real catalyst for some profit taking.
There's no way to know how much of this hot air will come out.
Saturday, June 27, 2009
Friday, June 26, 2009
JUN 29 Weekly Econ Consensus & Projection
Lately a lot of importance has been erroneously placed on the widely recognized innacuracy of the ADP report.
Still, expect some ridiculous market gyrations as a result.
Link MAY ISM report
Note that any number below 50 is still a decrease in manufacturing activity.
44 would be a slower loss than 42.8, but that's still the same as... NFP dropping by only 300k jobs rather than the previous 400k jobs.
We'd still be losing jobs! Thus the unemployment continues to increase.
Likewise, ISM at 44 is still a contraction (or loss) in manufacturing economic activity.
5count Wave Setup
Link to original 5count Wave post
Link to base chart
Considering the current poor status of the SPYsight EOD charts I think it prudent to consider a 5count Wave may be on the table.
I'm short the market via FAZ & EDZ, but still remain about half cash.
If SPY does fail at count 4 I'll add some more, however, the ISM & NFP estimates going into JUL do look favorable.
I could have argued this point at the early MAY spike, but there was also some decent econ news coming up, so I didn't. But now the $NYMO, $NYSI, $BPSPX & $SPXA50 have all gone sour, so... now is different.
Thursday, June 25, 2009
Wednesday, June 24, 2009
SPYsight EOD Charts Look Pretty Poor + $NYSI & NYMO
Little parity.
The indicators have dropped so much that there's an actually decent chance for a new run soon. The proverbial SPX >1000.
Or there's on helluva drop coming going into H209. The proverbial SPX <500.
MAY DGO Results Look Good: $6.5 Billion Gain (Real Numbers!)
Link to data
I still need "assistance" on how to total the sub-groups, though.
Hmm...
>:-(
New Orders
New orders for manufactured durable goods in May increased $2.8 billion or 1.8 percent to $163.9 billion, the U.S. Census Bureau announced today. This was the third increase in the last four months and followed a 1.8 percent April increase. Excluding transportation, new orders increased 1.1 percent. Excluding defense, new orders also increased 1.4 percent.
Shipments
Shipments of manufactured durable goods in May, down ten consecutive months, decreased $3.6 billion or 2.1 percent to $169.9 billion. This was the longest streak of consecutive monthly decreases since the series was first published on a NAICS basis in 1992 and followed a 0.5 percent April decrease.
Unfilled Orders
Unfilled orders for manufactured durable goods in May, down eight consecutive months, decreased $2.0 billion or 0.3 percent to $747.5 billion. This followed a 1.1 percent April decrease.
Inventories
Inventories of manufactured durable goods in May, down five consecutive months, decreased $2.5 billion or 0.8 percent to $323.3 billion. This followed a 1.1 percent April decrease.
Capital Goods Industries
Nondefense
Nondefense new orders for capital goods in May increased $4.9 billion or 10.0 percent to $53.8 billion.
Defense
Defense new orders for capital goods in May increased $0.8 billion or 7.4 percent to $12.0 billion.
Tuesday, June 23, 2009
DGO Coming Up for MAY
Consensus is for a 0.9% drop on the headline fabrication = $160,000M.
Lord only knows out of what hat they're gonna pull that multiplier from.
May Existing-Home Sales Continue Rising Trend
Washington, June 23, 2009
Sales of existing homes showed another gain in May, benefiting from favorable affordability conditions and a first-time buyer tax credit, according to the National Association of Realtors®. May’s increase was the first back-to-back monthly gain since September 2005.
Existing-home sales – including single-family, townhomes, condominiums and co-ops – rose 2.4 percent to a seasonally adjusted annual rate1 of 4.77 million units in May from a downwardly revised level of 4.66 million units in April, but remained 3.6 percent below the 4.95 million-unit pace in May 2008.
Lawrence Yun, NAR chief economist, expected an improvement. “Historically low mortgage interest rates clearly drew buyers into the market, and housing remains very affordable even with a recent uptick in rates,” he said. “First-time buyers also are being drawn off the sidelines by the $8,000 tax credit, which is helping to absorb inventory. However, the increase in sales is less than expected because poor appraisals are stalling transactions. Pending home sales indicated much stronger activity, but some contracts are falling through from faulty valuations that keep buyers from getting a loan.”
According to Freddie Mac, the national average commitment rate for a 30-year, conventional, fixed-rate mortgage edged up to 4.86 percent in May from a record low 4.81 percent in April; the rate was 6.04 percent in May 2008. Last week, Freddie Mac reported the 30-year fixed at 5.38 percent; data collection began in 1971.
Total housing inventory at the end of May fell 3.5 percent to 3.80 million existing homes available for sale, which represents a 9.6-month supply2 at the current sales pace, down from a 10.1-month supply in April.
[Fuzz: This is fairly good!]
Yun said the appraisal problem is serious. “Lenders are using appraisers who may not be familiar with a neighborhood, or who compare traditional homes with distressed and discounted sales,” he said. “In the past month, stories of appraisal problems have been snowballing from across the country with many contracts falling through at the last moment. There is danger of a delayed housing market recovery and a further rise in foreclosures if the appraisal problems are not quickly corrected.”
[Fuzz: This is very troubling.]
An NAR practitioner survey in May showed first-time buyers accounted for 29 percent of transactions, and that the number of buyers looking at homes is nearly 10 percentage points higher than a year ago. “This is the time of year when we see large increases in the number of repeat buyers, who are benefitting from sales to entry-level buyers,” Yun said. “Investors appear less active, but are more prevalent in areas with large price corrections.”
NAR President Charles McMillan, a broker with Coldwell Banker Residential Brokerage in Dallas-Fort Worth, said appraisals and the tax credit are key issues. “To maximize the potential for a housing recovery and subsequent economic recovery, we need realistic appraisals that are based on proper comparisons and done by a local specialist,” he said. “In addition, the first-time buyer tax credit should be expanded to all buyers of primary homes regardless of income. Extending the credit into 2010 would allow more time for the market to catch up with underlying demand, in part because many families with children, who normally time their purchase based on school year considerations, do not have enough time to move before the start of school in late August.
“Freeing a pent-up demand in housing will absorb inventory at a faster pace, strengthen communities and stabilize home prices earlier,” McMillan said.
The national median existing-home price3 for all housing types was $173,000 in May, down 16.8 percent from a year earlier. Distressed properties, which declined to 33 percent of all sales in May from 45 percent in April, continue to downwardly distort the median price because they generally sell at a discount relative to traditional homes.
“The decline in the distressed sales share likely results from an increase of repeat buyers in May,” Yun said. “First-time buyers are concentrated in the lower price ranges, which include most of the distressed sales.”
Single-family home sales rose 1.9 percent to a seasonally adjusted annual rate of 4.25 million in May from a pace of 4.17 million in April, but are 3.0 percent below the 4.38 million-unit level in May 2008. The median existing single-family home price was $172,900 in May, down 16.1 percent from a year ago.
Existing condominium and co-op sales increased 6.1 percent to a seasonally adjusted annual rate of 520,000 units in May from 490,000 in April, but are 8.9 percent below the 571,000-unit level in May 2008. The median existing condo price4 was $173,800 in May, down 21.9 percent from a year earlier.
Regionally, existing-home sales in the Northeast rose 3.9 percent to an annual level of 800,000 in May, but are 10.1 percent below a year ago. The median price in the Northeast was $243,600, which is 12.5 percent below May 2008.
Existing-home sales in the Midwest jumped 9.0 percent in May to a pace of 1.09 million but are 4.4 percent below May 2008. The median price in the Midwest was $145,800, which is 10.4 percent lower than a year ago.
In the South, existing-home sales were unchanged at an annual pace of 1.74 million in May but are 8.9 percent below a year ago. The median price in the South was $157,400, down 9.9 percent from May 2008.
Existing-home sales in the West slipped 0.9 percent to an annual rate of 1.14 million in May, but are 11.8 percent higher than May 2008. The median price in the West was $197,700, down 30.6 percent from a year ago.
The National Association of Realtors®, “The Voice for Real Estate,” is America’s largest trade association, representing 1.2 million members involved in all aspects of the residential and commercial real estate industries.
# # #
NOTE: Any references to performance in states or metro areas are from unpublished raw data used to analyze regional trends; please contact your local association of Realtors® for more information.
1The annual rate for a particular month represents what the total number of actual sales for a year would be if the relative pace for that month were maintained for 12 consecutive months. Seasonally adjusted annual rates are used in reporting monthly data to factor out seasonal variations in resale activity. For example, home sales volume is normally higher in the summer than in the winter, primarily because of differences in the weather and family buying patterns. However, seasonal factors cannot compensate for abnormal weather patterns.
Existing-home sales, which include single-family, townhomes, condominiums and co-ops, are based on transaction closings. This differs from the U.S. Census Bureau’s series on new single-family home sales, which are based on contracts or the acceptance of a deposit. Because of these differences, it is not uncommon for each series to move in different directions in the same month. In addition, existing-home sales, which generally account for 85 to 90 percent of total home sales, are based on a much larger sample – more than 40 percent of multiple listing service data each month – and typically are not subject to large prior-month revisions.
Single-family data collection began monthly in 1968, while condo data collection began quarterly in 1981; the series were combined in 1999 when monthly collection of condo data began. Prior to this period, single-family homes accounted for more than nine out of 10 purchases. Historic comparisons for total home sales prior to 1999 are based on monthly single-family sales, combined with the corresponding quarterly sales rate for condos.
2Total inventory and month’s supply data are available back through 1999, while single-family inventory and month’s supply are available back to 1982.
3The only valid comparisons for median prices are with the same period a year earlier due to the seasonality in buying patterns. Month-to-month comparisons do not compensate for seasonal changes, especially for the timing of family buying patterns. Changes in the composition of sales can distort median price data. Year-ago median and mean prices sometimes are revised in an automated process if more data is received than was originally reported.
4Because there is a concentration of condos in high-cost metro areas, the national median condo price generally is higher than the median single-family price. In a given market area, condos typically cost less than single-family homes.
Existing-home sales for June will be released July 23. The next Pending Home Sales Index & Forecast is scheduled for July 1; release times are 10 a.m. EDT.
Information about NAR is available at www.realtor.org. This and other news releases are posted in the News Media section. Statistical data in this release, other tables and surveys also may be found by clicking on Research.
Monday, June 22, 2009
EDZ Sold on Stupid Bounce, FAZ Closed Out on Just Plain Stupidity
World Bank has cut its 2009 global growth forecast, saying the world economy will shrink by 2.9 percent
Out of FAZ @ $5.19, accidently.
In an attempt to raise the stop-loss from $5.10 to $5.15 I accidentally put in a plain old limit order @ $5.15 and somehow magically sold at $5.19.
??
:-P
Dumb Dora.
MAY ExHomes Coming Up TUE!
Consensus is for 4.85M MAY ExHomes, 10am EST.
I'm interested in the months of supply, APR revision & MAY median/mean prices.
Link to APR PDF
MAY DGO on TUE should be a fair bummer, so if these MAY ExHomes are riddled with foreclosures then this'll be down week ferr sherr, especially with any $USD grabbing news to boot.
Saturday, June 20, 2009
Thursday, June 18, 2009
Bought SPY JUN $92 Puts @ $0.82, SWGRN
There's little relevant news tomorrow or Monday.
TUE is ExHomes, and while probably positive, this kind of data is taking a backseat to manufacturing data.
I imagine there's little reason to go long over the weekend, so I'm shorting today ahead of tomorrow while SPY runs up in valuation to the upper trend line with no money shoving it.
Wednesday, June 17, 2009
Tuesday, June 16, 2009
New Links Group! - RAW DATA
I got tired of hunting these down at irregular intervals & trying to figure out "when" these data releases would happen.
"c." means circa, or about.
c. 15th means the data is released about the 15th.
"DoM" = Day of Month
"WoM" = Week of Month
"EoM" = End of Month
"TTotM" = That Time of the Month
;-)
And of course, I'll routinely add relevant links to this group at random times.
FWIW, I can't stand "annualized" stats.
What hogwash.
"Seasonally adjusted" fabrications aren't much better.
Somewhere there are three pocket protector nerds sitting in plastic chairs at a small round table under florescent lights in the cafeteria working on a box of plain Krispy Kremes arguing over if any give raw number should be inflated or deflated by 3% to 8%.
Pfft.
Quit "helping" us, a$$holes.
Just gimme the GD numbers.
Monday, June 15, 2009
Sunday, June 14, 2009
Existing Homes Sales Charts
Link to data Source
Note the differences between 2006 & current Annualized Sales, Inventory & Months of Supply.
Saturday, June 13, 2009
Q2 Econ Events & Results Chart
Thursday, June 11, 2009
SPY Current & Upcoming Econ Events
Retail sales came in right on the button at 0.5% gain.
I totally fucked-up that call.
I don't believe the numbers, and I'm sure they'll be grossly revised down next month, but for today... I got it wrong.
D@mn ham.
FWIW, market should keep on going up for a few more weeks.
I think that even if all economic activity in the next month or two is flat that the market will be up.
If there was going ot be any reported weakness it would've been a lagging slump from MAY into APR.
Instead, we have a (bogus) APR Durable Goods Orders, foreclosure drenched ExHomes sales with increasing supply, declining drops in both initial claims & NFP and now a (dubious & largely flat) APR Retail Sales.
I don't see why any of this won't fare any worse going into JUL from JUN.
I'm sure the numbers will be just... ducky.
In fact, this past two weeks of infuriating, range bound consolidation should result in another short squeeze.
No rush till MAY Durable Goods two weeks away, though.
Options Expiration week is next week, so I'd expect some continuing, non-directional gyrations.
I'd be surprised if a lasting short squeeze manifested next week.
APR Retail Sales 0.5% Meets Estimates (WOW!)
Wow.
Link to Source
That's... uh... quite some rabbit they pulled out of a hat.
People are still buying a lot of food.
Health & Personal Care is doing quite well.
YoY General Merch is actually flat.
Furniture & Electronics are down despite Construction Materials being up.
I am shocked that these (dubious) numbers are so well.
I can't wait to see how JUN & JUL do.
Wednesday, June 10, 2009
MAY Retail Sales 0830 THU, 0.4% estimated
The last retail sales release was MAY 13 for the month of APR.
They were shooting for a nice, quiet, flat boring old 0.0% over the revised down MAR $338,930 million.
Instead we got a -0.4 shrink to $337,677 million, ex-auto.
Market tanked.
THU we're shooting for a magnificent 0.4% growth over that $337,677 million = $339,027, ex-auto.
This $1.35 million jump seems a wee ambitious considering the history of APR to MAY Retail Sales changes.
I think between the increasing unemployment and the contraction of credit that US consumers will still be clutching onto their increasingly threatened paychecks.
I'll be ditching all long positions WED & initiating short positions via FAZ, TZA & EDZ.
I'll wait until release to before increasing the position or closing it.
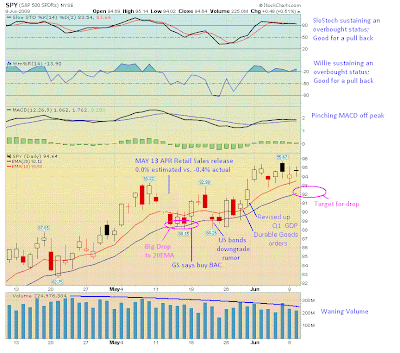
Note the MAY 13 drop went nowhere until the 18th when GS said to buy BAC, that went on for a few days before Moody's (I think it was) suggested EU bonds could be downgraded which in turn incited rumors of US debt being downgraded.
I forget what was so magical on & since MAY 26 that erased all of that.
Monday, June 8, 2009
PreMarket: S&P Downgrade Ireland to AA+, Looking @ JUN Calls
Wait a day or two before going long on much.
Typically when the slope gets to the mid-line it putzs around a coupla days in & around the 10/20EMAs before resuming an uptrend.
I bet we wedge ourselves into another short squeeze at the next release of $USD negative news.
FWIW, there's no fundamental reason for a monster drop now, and there's more of a reason for the mkt to continue up.
Rising short bond yields indicate money coming away from the security of Treasuries and into the mkt.
I suspect a really high bid-to-cover ratio on lower yielding Treasuries (indicating fear) or the first lousy ExHomes sales/price will tank the mkt.
Don't know when that'll be, except for the houses, which may be JUL or AUG.
10:30 Bellllllls! That was a low.
12:00 Well(p), maybe not.
1300 YEAY! Another low!
(Still ain't buying calls, yet)
Saturday, June 6, 2009
Thursday, June 4, 2009
Tuesday, June 2, 2009
Monday, June 1, 2009
FRI's $CPCI & $CPC
The market's about to punch through that 200DMA which doesn't appear to present as a triple top bounce point in the current econ environment.
The favorable, light econ week ahead could be enough to force that next short squeeze I've been blabbing about.
So far so good with German Retail Sales.
>> When adjusted for calendar and seasonal variations, April turnover rose 0.5% in real terms, month-on-month. Economists had been expecting a 0.1% decline in the month <<
APR US Spending is good to fair, but more importantly, wages remain increasing indicating zero competition for labor (surprising considering the available labor pool these days) or deflation.
>> The Commerce Department said spending slipped 0.1 percent after a revised 0.3 percent fall in March, previously reported as a 0.2 percent drop. That was slightly better than market expectations for a 0.2 percent fall in spending.
Personal income rose 0.5 percent, the biggest increase since May last year, after falling by a revised 0.2 percent in March, which had been reported as a 0.3 percent decline in March. Analysts polled by Reuters had forecast income to fall 0.2 percent in April.
Excluding the stimulus package, real disposable income increased 0.7 percent in April. Savings jumped to a record annual rate of $620.2 billion. The savings rate rose to 5.7 percent in April, the highest level since February 1995, from 4.5 percent the previous month. <<